Fix: Geth eth_getLogs Matcher Goroutine Leak and Head Livelock
On high-throughput EVM mainnets, rollup sequencers, and Arbitrum Orbit Nitro nodes, node operators and RPC gateway engineers frequently report severe degradation in query responsiveness: without warning, eth_getLogs response times over block ranges at or near the chain head spike from a baseline of 4–6 ms to 12–15+ seconds. Standard health checks fail, indexers like The Graph drop behind the tip, and RPC load balancers begin severing client connections.
This failure mode is triggered by a concurrency leak inside go-ethereum’s core/filtermaps subsystem: when external clients cancel or timeout their HTTP/WebSocket connections during intensive log filtering, the spawned matcher goroutines are not cleanly terminated. The accumulated orphaned workers continually hold locks on the filtermaps head indexer, precipitating a permanent livelock.
If your node is also encountering state reader panics following hard fork migrations, review our technical analysis on Geth State Reader Account Panic in PathDB / TrieDB.
Architectural Breakdown: FilterMaps Head Contention
Geth organizes log indexing into two distinct tiers: immutable disk-backed bloom filters for canonical historical epochs, and an in-memory FilterMap cache for unfinalized blocks near the chain head.
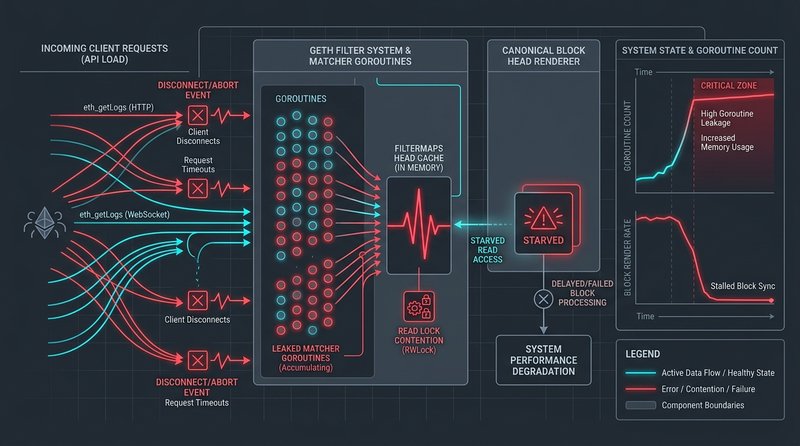
The Goroutine Lifecycle Trap
In eth/filters/filter_system.go and core/filtermaps, incoming eth_getLogs calls construct a Filter structure that dispatches matching jobs across multiple goroutines to inspect block bloom hashes:
// core/filtermaps/matcher.go (Simplified representation)
func (f *Filter) run(ctx context.Context) ([]*types.Log, error) {
    matcherCh := make(chan *types.Log, 128)

    // Concurrently scan block headers near head
    for _, header := range f.headers {
        go func(h *types.Header) {
            // CRITICAL FLAW: Lock acquisition on head cache does not
            // promptly monitor ctx.Done() during heavy lock contention
            f.headMap.RLock()
            defer f.headMap.RUnlock()

            logs := f.scanBlockLogs(h)
            select {
            case matcherCh <- logs:
            case <-ctx.Done():
                // If the channel receiver exited on client abort,
                // goroutine can stall waiting to acquire headMap lock
                return
            }
        }(header)
    }
    // ...
}
Pathological Cascade Mechanics
- Client Cancellation: An external indexer or dApp frontend requests logs across the last 100 blocks. Facing network lag, the client aborts the TCP connection or exceeds its 5-second HTTP timeout.
- Context Propagation Delay: Because HTTP reverse proxies frequently buffer requests or fail to notify the Go runtime of client disconnects (
http.CloseNotifier/ctx.Done()), Geth continues computing. - Head Renderer Starvation: The filtermaps head renderer requires write access (
Lock()) to update internal block caches as new blocks arrive. The dozens of accumulated, unreleased matcher goroutines continuously queue for read locks (RLock()), starving the renderer and stalling all new tip queries.
Step-by-Step Resolution Protocol
To resolve existing node stalls and safeguard Geth and Nitro instances against filtermaps livelock exhaustion, execute this three-phase remediation plan.
1. Identify Leaked Goroutines via Go pprof
Inspect your running node’s runtime profiling endpoint to verify whether matcher goroutines are accumulating in the runtime pool:
# Dump currently active goroutine stack traces
curl -s http://127.0.0.1:8545/debug/pprof/goroutine?debug=1 | grep -E "eth/filters|filtermaps" -A 5

# Check total goroutine count (healthy baseline: 400–1,200; leak state: 15,000+)
curl -s http://127.0.0.1:8545/debug/pprof/goroutine?debug=1 | head -n 1
If the goroutine count exceeds 10,000 with thousands stalled in filtermaps.(*FilterMap).RLock, the node has entered the livelock state.
2. Configure Upstream Reverse Proxy to Forward Client Aborts
If you use Nginx, Envoy, or HAProxy in front of Geth’s JSON-RPC port (8545), ensure client connection drops immediately cancel the backend upstream socket:
# /etc/nginx/conf.d/geth-rpc.conf
upstream geth_backend {
    server 127.0.0.1:8545 max_fails=3 fail_timeout=10s;
    keepalive 64;
}

server {
    listen 443 ssl http2;
    server_name rpc.yourdomain.internal;

    # CRITICAL: Do NOT ignore client aborts. Terminate upstream queries immediately!
    proxy_ignore_client_abort off;

    # Limit log request execution time
    proxy_read_timeout 8s;
    proxy_send_timeout 8s;

    location / {
        proxy_pass http://geth_backend;
        proxy_http_version 1.1;
        proxy_set_header Connection "";
        proxy_set_header Host $host;
        proxy_set_header X-Real-IP $remote_addr;

        # Mitigate memory exhaustion from monstrous log spans
        client_max_body_size 2m;
    }
}
3. Apply Defensive Geth Startup Flags
Restart Geth or Nitro node instances with strict bounds on log processing and RPC resource consumption:
# Recommended production flags for Geth node operators
geth \
  --mainnet \
  --http \
  --http.api "eth,net,web3" \
  --http.addr "127.0.0.1" \
  --http.port 8545 \
  --rpc.gascap 50000000 \
  --rpc.evmtimeout 5s \
  --rpc.txfeecap 1 \
  --ws \
  --ws.origins "*" \
  --cache 8192 \
  --maxpeers 50
Note: Setting --rpc.evmtimeout 5s and limiting --rpc.gascap terminates rogue computational filters before matcher routines can congest the head lock.
Production Verification Checklist
| Operational Verification | Diagnostic Command | Expected Target |
|---|---|---|
| Active Goroutines | curl -s localhost:8545/debug/pprof/goroutine?debug=1 | head -n 1 | < 2,500 goroutines under peak indexing load. |
| Tip Log Query Latency | time curl -X POST -H "Content-Type: application/json" --data '{"jsonrpc":"2.0","method":"eth_getLogs","params":[{"fromBlock":"latest","toBlock":"latest"}],"id":1}' localhost:8545 | Real execution time <= 15ms. |
| Client Abort Signal | Run curl and send SIGINT (Ctrl+C) mid-query | Nginx upstream log records 499 Client Closed Request and Geth releases context immediately. |
| Head Cache Lock State | go tool pprof http://localhost:8545/debug/pprof/block | Zero accumulated lock delay spikes on filtermaps.headMap. |
Frequently Asked Questions
Q: Why do indexers experience this issue more severely than ordinary web users?
Indexers continuously poll ranges matching recent block numbers using concurrent worker pools. When a temporary network spike delays RPC packet delivery, the indexer aborts its workers and immediately retries. Without client abort forwarding, previous worker queries continue executing in the background, compounding lock contention exponentially.
Q: Does upgrading to TrieDB PathDB fix this log filtering issue?
No. PathDB optimizes state storage format on disk (account and storage tries), whereas the filtermaps issue exists in the runtime RPC log indexing layer and memory queue synchronization.
Q: Can log queries be isolated onto dedicated read-only nodes?
Yes, this is the recommended architectural pattern. Separate transaction submission nodes (which service eth_sendRawTransaction) from heavy archive/log query nodes using dedicated RPC routing clusters to ensure node consensus and state progression are never impacted by log filter livelocks.